Showing posts with label tipping point. Show all posts

Friday, September 15, 2023

Seafloor methane tipping point reached

The bold black line at the top of the image below, adapted from Climate Reanalyzer, shows extremely high sea surface temperatures up to September 13, 2023, much higher than in any previous year on record.

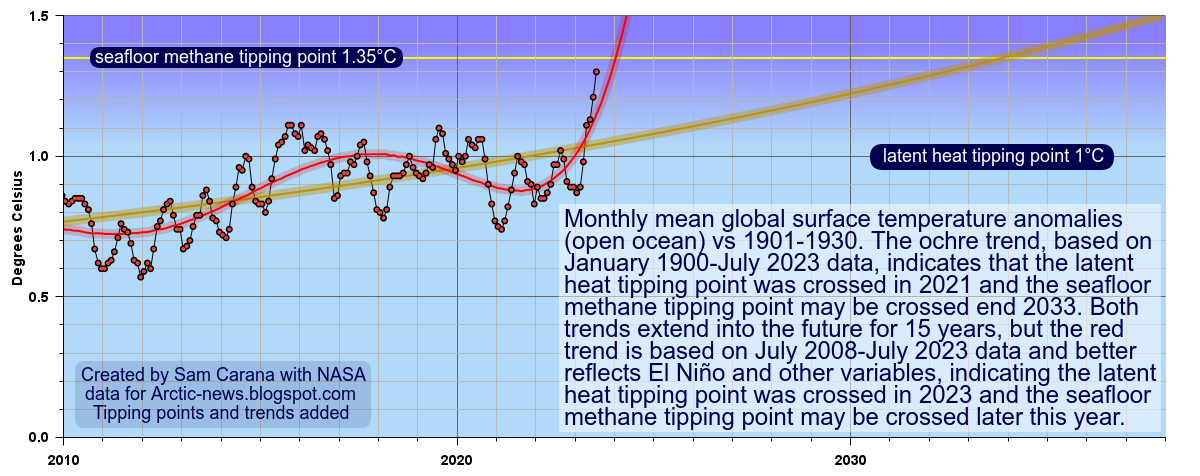
The image below, created with NASA data, shows why these extremely high sea surface temperatures are so worrying. The image shows monthly mean global surface temperature anomalies (open ocean) vs 1901-1930. The ochre trend, based on January 1900-August 2023 data, indicates the latent heat tipping point was crossed in 2021 and the seafloor methane tipping point could be crossed in 2033. The red trend, based on August 2008-August 2023 data and better reflecting variables such as El Niño, indicates that the seafloor methane tipping point could be crossed late 2023. Data show the seafloor methane tipping point was reached in August 2023.

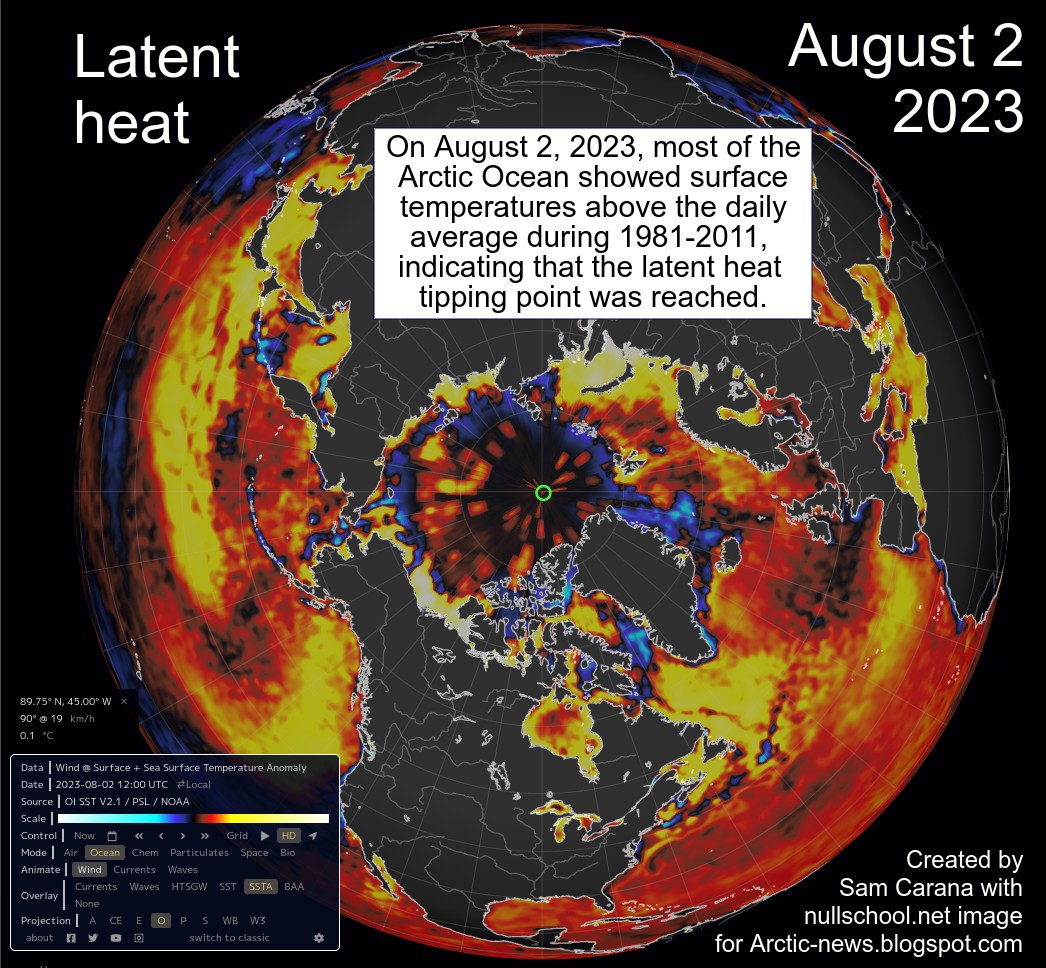
The latent heat tipping point is estimated to correspond with a sea surface temperature anomaly of 1°C above the long term average, 1901-1930 on the above image, as discussed in earlier posts such as this one.

Sea ice constitutes a latent heat buffer, consuming incoming heat as it melts. While the ice is melting, all energy (at 334 J/g) goes into changing ice into water and the temperature remains at 0°C (273.15K or 32 °F). Once all ice has turned into water, all subsequent energy goes into heating up the water, and will do so at 4.18 J/g for every 1°C the temperature of the water rises. 

Once Arctic sea ice has become very thin, ocean heat that was previously consumed by melting the sea ice, no longer gets consumed by melting of the sea ice, and further incoming heat instead gets absorbed by the Arctic Ocean, rapidly pushing up the temperature of the water of the Arctic Ocean. 

The latent heat tipping point has meanwhile been crossed. Loss of this buffer is linked to the seafloor methane tipping point, i.e. the point where additional heat reaches the seafloor and destabilizes hydrates contained in sediments at the seafloor. This tipping point comes with multiple self-reinforcing feedback loops, such as explosive growth in methane volume setting off further destabilization, rapid rise of Arctic temperatures, loss of permafrost and loss of albedo, and release of further greenhouse gases.

Crossing of the seafloor methane tipping point will occur later than crossing of the latent heat tipping point, i.e. the seafloor methane tipping point corresponds with a higher ocean temperature anomaly, estimated to correspond with a sea surface temperature anomaly of 1.35°C above the long term average.

The current situation is particularly precarious in the Arctic, as the North Atlantic Ocean is very hot and the Gulf Stream keeps pushing hot water toward the Arctic Ocean, while Arctic sea ice has become very thin and the latent heat tipping point has been crossed.

As the temperature of the Arctic Ocean keeps rising, more heat can reach sediments located at the seafloor, since much of the Arctic Ocean is very shallow and sediments at the seafloor of the Arctic Ocean can contain vast amounts of methane.

The danger is that additional heat will destabilize hydrates in these sediments, leading to explosive eruptions of methane, as its volume increases 160 to 180-fold when leaving the hydrates, and resulting in huge eruptions of methane both from the destabilizing hydrates and from methane that is present in the form of free gas underneath the hydrates.

[ from earlier post, click on images to enlarge ]

The above image, from an earlier post, illustrates that warnings have been given before about the danger of these two tipping points getting crossed in the Arctic. In the above image, the trends are based on annual sea surface temperature data for the Northern Hemisphere. The seafloor methane tipping point is estimated to correspond with ocean temperature anomalies reaching 1.35°C above the long term average.

The image below further illustrates the high sea surface temperatures in and around the Arctic Ocean, with the red to yellow colors indicating temperature anomalies above the 1981-2011 average, and the green circle marking a sea surface temperature anomaly near the North Pole of 0.4°C on September 13, 2023.  


The image below illustrates how incoming ocean heat that previously was consumed in the process of melting of the sea ice, is now causing the water of the Arctic Ocean to heat up, with more heat reaching the seafloor of the Arctic Ocean, which has seas that in many places are very shallow.

[ Latent heat loss, feedback #14 on the Feedbacks page ]
Further adding to the danger is that destabilization of methane hydrates can cause huge amounts of methane to erupt with great force from the seafloor in the form of plumes. Consequently, little of the methane can be broken down in the water by microbes, while there is very little hydroxyl in the atmosphere over the Arctic Ocean to break down the methane that enters the atmosphere.


[ click on images to enlarge ]
Ominously, very high methane levels continue to be recorded at Barrow, Alaska, as illustrated by the above NOAA image.

The MetOp satellite image on the right shows methane levels, with the magenta color indicating the highest methane levels recorded at surface level (1000 mb), on September 15, 2023 am.

The N20 satellite image underneath shows methane levels at an altitude corresponding with 487 mb on September 10, 2023 am. The magenta color again indicates the highest methane levels recorded at the time.

Note the high levels over the Beaufort Sea and elsewhere over the Arctic Ocean, as well as high levels recorded over oceans in the Southern Hemisphere.

Climate Emergency Declaration

A catastrophe of unimaginable proportions is unfolding. Life is disappearing from Earth and runaway heating could destroy all life on Earth. At 5°C heating, most life on Earth will have disappeared. When looking only at near-term human extinction, 3°C will likely suffice.

The situation is dire and is getting more dire every day, which calls for a Climate Emergency Declaration and implementation of comprehensive and effective action, as described in the Climate Plan with an update at Transforming Society.


Links

• Climate Reanalyzer - daily sea surface temperature
https://climatereanalyzer.org/clim/sst_daily

• NASA - GISS Surface Temperature Analysis

• Record high North Atlantic sea surface temperature


Tuesday, August 15, 2023

Two Tipping Points

The image below, adapted from Climate Reanalyzer, shows that the World Sea Surface Temperature (60°South - 60°North) was at a record high of 21.1°C or 69.98°F for the third day in a row on August 23, 2023. As the image also shows, sea surface temperatures over the past few months have been much higher for the time of year than in any other year on record. 

The image below shows why this recent sea surface temperature rise is so worrying. The image below is based on NASA data for monthly mean global surface temperature anomalies (open ocean) vs 1901-1930. The ochre trend, based on January 1900-July 2023 data, indicates that the latent heat tipping point was crossed in 2021 and the seafloor methane tipping point may be crossed by the end of 2033. Both trends extend into the future for 15 years, but the red trend is based on July 2008-July 2023 data and better reflects El Niño and other variables, and this red trend indicates that the latent heat tipping point was crossed in 2023 and the seafloor methane tipping point may be crossed later this year.

[ click on images to enlarge ]

Sea ice constitutes a latent heat buffer, consuming incoming heat as it melts. While the ice is melting, all energy (at 334 J/g) goes into changing ice into water and the temperature remains at 0°C (273.15K or 32 °F). Once all ice has turned into water, all subsequent energy goes into heating up the water, and wil do so at 4.18 J/g for every 1°C the temperature of the water rises. 

[ sea ice thickness, from earlier post ]
Loss of this buffer is linked to subsequent destabilization of methane hydrates. So, there are two tipping points that are linked, and the latent heat tipping point gets crossed in the Arctic before the seafloor methane tipping point gets reached.

The situation is particularly precarious in the Arctic, as the North Atlantic Ocean is very hot and the Gulf Stream keeps pushing hot water toward the Arctic Ocean, while Arctic sea ice has become very thin. The image on the right, from Uni of Bremen, shows that on July 25, 2023, there was virtually no Arctic sea ice left that was more than 30 cm thick. 

The latent heat tipping point is the point where Arctic sea ice loss is such that further incoming ocean heat that was previously consumed as Arctic sea ice melted, instead gets absorbed by the Arctic Ocean. 

[ sea surface temperature anomaly ]
The image on the right, adapted from nullschool.net, shows that on August 2, 2023, most of the Arctic Ocean was showing surface temperatures above the daily average during 1981-2011, indicating that the latent heat tipping point was reached. The latent heat tipping point is estimated to correspond with an ocean temperature anomaly of 1°C above the long term average, 1901-1930 on the above image.

The image underneath, also from nullschool.net, shows the situation on August 20, 2023, when temperatures at the North Pole had been above zero for more than a day and temperatures were forecast to go below zero only twice briefly afterwards, for the period up to August 24, 2023 19:00 UTC (which is as far as the forecast went at the time. 

[ surface temperature ]
This is a further indication that the latent heat tipping point has been reached and that no more heat can be consumed by sea ice melting.

How much sea ice is left? What does the sea ice look like, near the North Pole? Satellite images can give a good impression, but clouds can obscure the view. A clearer view can be obtained by comparing images over several days. 

An animation can reveal how much, or rather how little sea ice is left, and to what extent water of the Arctic Ocean is visible. 

[ Satellite view, click on images to enlarge ]
The animation on the right is made with four NASA Worldview images, showing the situation on August 11, 15, 16 and 19, 2023. 

The second tipping point, the seafloor methane tipping point, occurs as more heat reaches the seafloor where it destabilizes hydrates contained in sediments at the seafloor.

This tipping point comes with multiple self-reinforcing feedback loops, such as explosive growth in methane volume setting off further destabilization, rapid rise of Arctic temperatures, loss of permafrost and loss of albedo, and release of further greenhouse gases.

Crossing of the seafloor methane tipping point will occur later than crossing of the latent heat tipping point, so the seafloor methane tipping point is estimated to correspond with a higher ocean temperature anomaly.

The current situation is particularly precarious in the Arctic, as the North Atlantic Ocean is very hot and the Gulf Stream keeps pushing hot water toward the Arctic Ocean, while Arctic sea ice has become very thin (image right) and the latent heat tipping point has been crossed.

As the temperature of the Arctic Ocean keeps rising, more heat can reach sediments located at the seafloor, since much of the Arctic Ocean is very shallow and sediments at the seafloor of the Arctic Ocean can contain vast amounts of methane.

The danger is that further heat will destabilize hydrates in these sediments, leading to explosive eruptions of methane, as its volume increases 160 to 180-fold when leaving the hydrates, and resulting in huge eruptions of methane both from the destabilizing hydrates and from methane that is present in the form of free gas underneath the hydrates.

[ from earlier post, click on images to enlarge ]

The above image, from an earlier post, illustrates that warnings have been given before about the danger of these two tipping points getting crossed in the Arctic. In the above image, the trends are based on annual sea surface temperature data for the Northern Hemisphere. The seafloor methane tipping point is estimated to get crossed when the ocean temperature anomaly on the Northern Hemisphere goes beyond 1.35°C above its long term average.

The Argo Float 7900549 compilation image below illustrates that the highest water temperatures in the Arctic Ocean can occur at a depth of approximately 100 meters. The image shows temperatures as high as 5°C at that altitude.


Stronger winds along the path of the Gulf Stream can at times speed up sea currents that travel underneath the surface. As a result, huge amounts of hot, salty water can travel from the Atlantic Ocean into the Arctic Ocean, abruptly pushing up temperatures and salinity levels at the bottom of the Arctic Ocean, which in many places is very shallow.


The above image shows details of Argo float 9701007, further illustrating the danger that heat can reach the seafloor. North of Norway, where the water is less than 400 m deep, temperatures higher than 5°C show up throughout the vertical water column, up to August 10, 2023, when temperatures above 11°C were recorded close to the sea surface. The colored inset also shows that greater mixing down of heat occurred from October to December 2022, as the sea ice started to return and seal off the surface, preventing heat transfer from ocean to atmosphere, as also discussed at FAQ #11.

Below is another image adapted from Climate Reanalyzer, showing that the sea surface temperature of the North Atlantic Ocean has for months been much higher for the time of year than it was in previous years on record. Eight causes behind this have been discussed in an earlier post. The image below shows the situation on August 28, 2023, with the North Atlantic sea surface temperature reaching a record high of 25.34°C or 77.61°F. 


The image below, adapted from NOAA, shows how the Gulf Stream is pushing ocean heat toward the Arctic Ocean, while sea surface temperatures show up as high as 33.6°C or 92.48°F on August 17, 2023. 


[ 2022 animation ]
Studies, some of them dating back more than two decades, show that over the shallow East Siberian Arctic Shelf (ESAS) winds at times can mix the water column from the top to the bottom. A 2005 study of the ESAS led by Igor Semiletov recorded water temperatures at the seafloor, in September 2000, of 4.7°C at 20m depth at one location and 2.11°C at 41m depth at another location, with salinity levels of 29.7‰ and of 31.7‰, respectively.

A deformed Jet Stream, in combination with a cyclone, could similarly result in strong winds abruptly pushing a huge amount of heat through the Bering Strait into the Arctic Ocean. 

The animation on the right shows how remnants of Typhoon Merbok were forecast to enter the Arctic Ocean through the Bering Strait from September 17 to 19, 2022.

The image below, adapted from Climate Reanalyzer, shows that the (2-meter) air temperature in the Arctic was 3.79°C on August 25, 2023, a record high for the time of year and 2.08°C higher than the 1979-2011 mean for that day.


The image below illustrates how incoming ocean heat that previously was consumed in the process of melting of the sea ice, is now causing the water of the Arctic Ocean to heat up, with more heat reaching the seafloor of the Arctic Ocean, which has seas that in many places are very shallow.

[ Latent heat loss, feedback #14 on the Feedbacks page ]
Further adding to the danger is that destabilization of methane hydrates can cause huge amounts of methane to erupt with great force in the form of plumes. Consequently, little of the methane can be broken down in the water by microbes, while there is very little hydroxyl in the atmosphere over the Arctic Ocean to break down the methane that enters the atmosphere.

Ominously, some very high methane levels were recorded recently at Barrow, Alaska, as illustrated by the NOAA images below.

The most recent monthly methane average recorded at Barrow, Alaska, is above 2080 parts per billion.

In the video below, Guy McPherson describes the dire situation.


Climate Emergency Declaration

A catastrophe of unimaginable proportions is unfolding. Life is disappearing from Earth and runaway heating could destroy all life. At 5°C heating, most life on Earth will have disappeared. When looking only at near-term human extinction, 3°C will likely suffice.

The situation is dire and is getting more dire every day, which calls for a Climate Emergency Declaration and implementation of comprehensive and effective action, as described in the Climate Plan with an update at Transforming Society.


Links

• Climate Reanalyzer - daily sea surface temperature
https://climatereanalyzer.org/clim/sst_daily

• Climate Reanalyzer - daily 2-meter air temperature
https://climatereanalyzer.org/clim/t2_daily

• NASA - GISS Surface Temperature Analysis
https://earth.nullschool.net

• NOAA - Barrow Atmospheric Baseline Observatory, United States
https://gml.noaa.gov/dv/iadv/graph.php?code=BRW&program=ccgg&type=ts

• Argo Float
https://fleetmonitoring.euro-argo.eu

• Remnants of Typhoon Merbok forecast to enter the Arctic Ocean through the Bering Strait from September 17 to 19, 2022.
Discussed at https://www.facebook.com/SamCarana/posts/10166948876390161, from:
https://arctic-news.blogspot.com/p/cold-freshwater-lid-on-north-atlantic.html

• The East Siberian Sea as a transition zone between Pacific-derived waters and Arctic shelf waters - by Igor Semiletov et al. (2005)
https://agupubs.onlinelibrary.wiley.com/doi/10.1029/2005GL022490

• Sea surface temperature at record high
https://arctic-news.blogspot.com/2023/03/sea-surface-temperature-at-record-high.html

• Record high North Atlantic sea surface temperature


Monday, July 31, 2023

Wet Bulb Globe Temperature Tipping Point

High Wet Bulb Globe Temperatures (WBGT) are forecast to hit Louisiana, United States, over the next few days. The image below shows a forecast for August 2, 2023, 18 UTC, with WBGT as high as 35°C forecast for a location 10 miles South East of Abbeville, Louisiana, U.S.


WBGT is a measure used by weather.gov to warn about expected heat stress when in direct sunlight. It takes into account the effect of temperature, relative humidity, wind speed, and solar radiation on humans.

As temperatures and humidity levels keep rising, a tipping point can be reached where the wind factor no longer matters, in the sense that wind can no longer provide cooling. The human body can cool itself by sweating, which has a physiological limit that was long described as a 35°C wet-bulb temperature. Once the wet-bulb temperature reaches 35°C, one can no longer lose heat by perspiration, even in strong wind, but instead one will start gaining heat from the air beyond a wet-bulb temperature of 35°C.

Accordingly, a 35°C wet-bulb temperature (equal to 95°F at 100% humidity or 115°F at 50% humidity) was long seen as the theoretical limit, the maximum a human could endure.

A 2020 study (by Raymond et al.) warns that this limit could be regularly exceeded with a temperature rise of less than 2.5°C (compared to pre-industrial). A 2018 study (by Strona & Bradshaw) indicates that most life on Earth will disappear with a 5°C rise. Humans, who depend for their survival on many other species, will likely go extinct with a 3°C rise, as illustrated by the image below, from an earlier post.


A 2022 study (by Vecellio et al.) finds that the actual limit is lower — about 31°C wet-bulb or 87°F at 100% humidity — even for young, healthy subjects. The temperature for older populations, who are more vulnerable to heat, is likely even lower. In practice the limit will typically be lower and depending on circumstances could be as low as a wet-bulb temperature of 25°C.


The above image shows a Wet Bulb Globe Temperature of 35°C (95°F) forecast for August 11, 2023, 19 UTC, for a location near Baton Rouge, Louisiana, U.S. 


Heat is the leading cause of weather-related deaths in the United States, as illustrated by the above image (credit: NOAA). Heat fatalities may be conservative figures. Recent research finds that where heat is being listed as an official cause of death, this likely underestimates the full toll of these events. Extreme heat can trigger heart attacks and strokes. In addition, some heart disease risk factors, such as diabetes—as well as heart medications, such as diuretics and beta blockers—can affect a person’s ability to regulate their body temperature and make it difficult to handle extreme heat. The study finds that extreme heat accounted for about 600-700 additional deaths from cardiovascular disease annually. A recent study estimates that extreme heat accounted for 12,000 premature deaths in the contiguous U.S. from 2000 to 2010, and a recent analysis calculates that the summer 2022 heatwave killed 61,000 people in Europe alone. 

The image below shows a temperature (°F) forecast for August 1, 2023, from Climate Reanalyzer


The video below discusses this.


Misery Index

The image below show a high reading on the 'Misery Index', the perceived ('feels like') temperature that is used by nullschool.net, combining wind chill and the heat index (which in turn combines air temperature and relative humidity, in shaded areas). A Misery Index temperature of 56.1°C or 133.1°F was recorded at a location off the coast of the United Arab Emirates (green circle) on August 5, 2023.


The temperature at that location at the time was 35.2°C or 95.4°F, lower than the temperature on the land surrounding the Gulf, but the relative humidity at that spot over the water was 78%, and that combination led to this very high 'feels like' temperature. 

This constitutes a warning. The sea, rivers and lakes are traditionally seen as places to go to, to cool off. However, high temperatures combined with high humidity over water bodies can result in conditions that go beyond what humans can bear. 

Climate change danger assessment

The image below, earlier discussed here, expands risk assessment beyond its typical definition as the product of the severity of impact and probability of occurrence, by adding a third dimension: timescale, in particular imminence.


Imminence alone could make that the danger constituted by rising temperatures needs to be acted upon immediately, comprehensively and effectively. While questions may remain regarding probability, severity and timescale of the dangers associated with climate change, the precautionary principle should prevail and this should prompt for action, i.e. comprehensive and effective action to reduce damage and improve the situation is imperative and must be taken as soon as possible.

Rapidly rising temperatures constitute tipping points in several ways 

Firstly, there is a biological threshold beyond which rising temperatures become lethal for humans, as discussed above. 

Secondly, as Gerardo Ceballos describes in the video below and in a 2017 analysis, there is a biological tipping point that threatens annihilation of species via the ongoing sixth mass extinction. Researchers such as Gerardo Ceballos (2020), Kevin Burke (2018) and Ignation Quintero (2013) have for years warned that mammals and vertebrates cannot keep up with the rapid rise in temperature. Humans are classified as vertebrate mammals, indicating that we will not avoid the fate of extinction, Guy McPherson (2020) adds. 

Thirdly, there are further tipping points, e.g. social-political ones. On the one hand, it would be good if people became more aware, as this could prompt more people into supporting the necessary action. On the other hand, as temperatures keep rising, there is also a danger that panic will break out, dictators will grab power and civilization as we know it will collapse abruptly, as warned about earlier, e.g. in 2007.  


Conclusion

In conclusion, to combat rising temperatures, transforming society is needed urgently, along the lines of this 2022 post in combination with declaration of a climate emergency.


Links

• Wet Bulb Globe Temperature
https://digital.mdl.nws.noaa.gov

• National Weather Service - Wet Bulb Globe Temperature: How and when to use it
https://www.weather.gov/news/211009-WBGT

• The emergence of heat and humidity too severe for human tolerance - by Colin Raymons et al. (2020)
https://www.science.org/doi/10.1126/sciadv.aaw1838

• Brief periods of dangerous humid heat arrive decades early
https://www.climate.gov/news-features/featured-images/brief-periods-dangerous-humid-heat-arrive-decades-early

• Evaluating the 35°C wet-bulb temperature adaptability threshold for young, healthy subjects (PSU HEAT Project) - by Daniel Vecellio et al. (2022)
https://journals.physiology.org/doi/full/10.1152/japplphysiol.00738.2021
Discussed at: https://www.facebook.com/groups/arcticnews/posts/10159973158374679

• NOAA - Weather Fatalities 2022
https://www.weather.gov/hazstat

• The Effects of Heat Exposure on Human Mortality Throughout the United States - by Drew Shindell (2021)
https://agupubs.onlinelibrary.wiley.com/doi/full/10.1029/2019GH000234

• Heat-related mortality in Europe during the summer of 2022 - by Joan Ballester et al.
https://www.nature.com/articles/s41591-023-02419-z
Discussed at: https://www.facebook.com/groups/arcticnews/posts/10160875637104679

• As Temperatures Spike, So Do Deaths from Heart Disease (2022 News release)
https://www.acc.org/About-ACC/Press-Releases/2022/03/22/20/06/As-Temperatures-Spike-So-Do-Deaths-from-Heart-Disease

• Association of Extreme Heat and Cardiovascular Mortality in the United States: A County-Level Longitudinal Analysis From 2008 to 2017 - by Sameed Khatana et al. (2022)
https://www.ahajournals.org/doi/10.1161/CIRCULATIONAHA.122.060746

• Co-extinctions annihilate planetary life during extreme environmental change, by Giovanni Strona and Corey Bradshaw (2018)
https://www.nature.com/articles/s41598-018-35068-1
Discussed at: https://www.facebook.com/groups/arcticnews/posts/10156903792219679

• When will we die?
https://arctic-news.blogspot.com/2019/06/when-will-we-die.html

• Climate Reanalyzer - Hourly Forecast Maps
https://climatereanalyzer.org/wx/fcst/?mdl_id=nam&dm_id=conus-lc&wm_id=t2

• PBS video - Too HOT and HUMID to Live: Extreme Wet Bulb Events are on the Rise 
https://www.pbs.org/video/too-hot-and-humid-to-live-extreme-wet-bulb-events-are-on-th-fazocs

• Nullschool
https://earth.nullschool.net

• How agriculture hastens species extinction | 60 Minutes (CBS News) | Gerardo Ceballos
https://www.youtube.com/watch?app=desktop&v=f21WWocqR-c

• Biological annihilation via the ongoing sixth mass extinction signaled by vertebrate population losses and declines - by Gerardo Ceballos, Paul R. Ehrlich and Rodolfo Dirzo (2017)
https://www.pnas.org/content/114/30/E6089

• Vertebrates on the brink as indicators of biological annihilation and the sixth mass extinction - by Gerardo Ceballos, Paul Ehrlich, and Peter Raven (2020)
https://www.pnas.org/content/early/2020/05/27/1922686117
Discussed at: https://www.facebook.com/groups/arcticnews/posts/10158460232764679

• Rates of projected climate change dramatically exceed past rates of climatic niche evolution among vertebrate species - by Ignatio Quintero et al. (2013) 

• Pliocene and Eocene provide best analogs for near-future climates - by Kevin Burke et al. (2018)
https://www.pnas.org/doi/10.1073/pnas.1809600115
Discussed at: https://www.facebook.com/groups/arcticnews/posts/10156972951354679

• Earth is in the Midst of Abrupt, Irreversible Climate Change - by Guy McPherson (2020)
https://www.onlinescientificresearch.com/articles/earth-is-in-the-midst-of-abrupt-irreversible-climate-change.pdf

Thursday, September 8, 2022

Blue Ocean Event 2022?

The image on the right shows a NASA Worldview satellite image of a blue Beaufort Sea (with Barrow, Alaska, at the top left, on September 7, 2022). 

The image shows that there is a lot of open water between the coast of Alaska and the sea ice.

Such a satellite image provides a visual way to determine how much sea ice is present. It can be hard to determine where there is open water and where the sea ice starts; the sea ice is often covered by clouds; furthermore, even when there are no clouds, the question remains what is to be regarded as sea ice and what is to be regarded as water. 

Another way to measure how much sea ice is there is to look at sea ice concentration. Sea ice concentration in the Central Arctic region has been very low for some time. 

The image on the right, from an earlier post, shows that on August 12, 2022, sea ice concentration in a large area close to the North Pole was as low as 0%. 

In the two images below, Nico Sun calculates the impact of albedo loss based on NSIDC sea ice concentration data. The images illustrate why sea ice loss in the Central Arctic region is so important.

The image below shows that further albedo loss in the Barents Sea, which is virtually icefree at the moment, doesn't make much difference now. 


The image below shows that, by contrast, more albedo loss in the Central Arctic region makes much more difference, even in September. 


Arctic sea ice has become extremely thin, so the latent heat buffer loss is also very strong. This loss of the latent heat buffer can continue to result in higher temperatures of the water for a long time, even long after insolation has passed its annual peak on the Northern Hemisphere, thus causing the combined accumulative impact to continue to be high.

Another way to measure how much sea ice is present is to look at the extent of the sea ice. According to many, a Blue Ocean Event starts once the Arctic sea ice falls below 1 million km² in extent.

Arctic sea ice extent was 4.912 million km² on September 6, 2022, which is larger than the extent in many previous years around this time of year (see NSIDC image below). However, the sea ice has become very thin, resulting in many areas where only small pieces of ice are present. 


NSIDC regard a cell to have sea ice if it has at least 15% sea ice, but when regarding a cell to have sea ice if it has at least 50% ice and if that's the case for ⅕ of the cells where there is (some) ice, then we're already in a Blue Ocean Event right now.

So let's have another look at how much of the above 4.912 million km² can be regarded as sea ice, by using the NSIDC map with sea ice concentration as a guide. 

The roughly-sketched outline drawn over the NASA map below indicates that there may only have been some 991 thousand km² of concentrated sea ice left on September 6, 2022 (inset shows NSIDC sea ice concentration for the day). 


As said, it's a rough sketch, so some cells with a higher concentration of sea ice may have been left out. Having said that, we're currently in the depth of a persistent La Niña and the associated lower air temperatures contribute to a relatively larger sea ice extent than would otherwise be the case. 

In conclusion, depending on what is counted as sea ice, we could already be experiencing a Blue Ocean Event right now. 

Further events and developments

A Blue Ocean Event constitutes the crossing of a huge tipping point and, as a strong El Niño looks set to emerge, this could trigger the unfolding of further events and developments leading to extinction of most species (including humans), as: 
  1. a strong El Niño triggers: 
  2. further decline of the Arctic sea ice, with loss of the latent heat buffer, combined with
  3. associated loss of sea ice albedo and
  4. destabilization of seafloor methane hydrates, causing eruption of vast amounts of methane that further speed up Arctic warming and cause
  5. rapid thawing of terrestrial permafrost, resulting in even more emissions,
  6. while the Jet Stream gets even more deformed, resulting in more extreme weather events
  7. causing forest fires, at first in Siberia and Canada and
  8. eventually also in the peat fields and tropical rain forests of the Amazon, in Africa and South-east Asia, resulting in
  9. decline of snow and ice on mountains, at first causing huge flooding, followed by 
  10. drought, heatwaves and urban collapse,
  11. collapse of the Greenland and West-Antarctic ice sheets,
  12. falling away of aerosol masking as civilization grinds to a halt, 
  13. further heating due to gases and particulates from wood and waste burning and biomass decomposition, and 
  14. further heating due to additional gases (including water vapor), cirrus clouds, albedo changes and heat rising up from oceans. 


Importantly, depicted above is only one scenario out of many. Things may eventuate in different order and occur simultaneously, i.e. instead of one domino tipping over the next one sequentially, many events may occur simultaneously and reinforce each other. Further events and developments could be added to the list, such as ocean stratification and stronger storms that can push large amounts of warm salty water into the Arctic Ocean.


Here is another example of such a scenario. Recent studies indicate that human-caused climate change will soon increase El Niño frequency and intensity. Accordingly, the upcoming El Niño may well be strong. As illustrated with above image, we're currently in the depth of a persistent La Niña, which suppresses the temperature rise, whereas the opposite occurs during El Niño, which amplifies the temperature rise, and this especially affects the Arctic, which is already heating up much faster than the rest of the world. Also, the upcoming El Niño may very well coincide with a peak in sunspots in 2025, further pushing up temperatures.

The image below shows that the rise in sea surface temperatures on the Northern Hemisphere has been suppressed during the ongoing La Niña, but as we move into the next El Niño, the seafloor methane tipping point could be crossed even earlier than the current trend indicates, say by 2025. 


One reason for this is that the narrowing temperature difference between the Arctic and the Tropics will further deform the Jet Stream and in turn cause more extreme weather, leading to more loss of sea ice and thus of its capacity to reflect sunlight and act as a buffer against incoming ocean heat.

A huge amount of heat has built up in the North Atlantic off the coast of North America, as illustrated by the image on the right.

Furthermore, the temperature of the water may well be substantially higher some 50 meter below the sea surface than at the sea surface. 

As discussed in an earlier post, rising temperatures result in stronger winds along the path of the Gulf Stream that can make huge amounts of warm, salty water travel from the Atlantic Ocean toward the Arctic and reach shallow parts of the Arctic Ocean such as the East Siberian Arctic Shelf (ESAS), where most of the sea is less than 50 m deep. The danger is illustrated by the Argo float compilation below.


Very high methane levels

The image below, from an earlier post, shows annual global mean methane with a trend added that points at a methane rise that could in 2028 represent a forcing of 780 ppm CO₂e (with a 1-year GWP of 200). 

In other words, the clouds tipping point at 1200 ppm CO₂e could be crossed in 2028 due to the forcing of methane and CO₂ alone, assuming that CO₂ concentration in 2028 will exceed 420 ppm. Moreover, this could happen even earlier, since there are further forcers, while further events and developments could additionally push up the temperature further, as discussed above. Furthermore, the NOAA data used in the above image are for marine surface measurements. More methane tends to accumulate at higher altitudes, as illustrated by the compilation image below. 


NOAA's globally averaged marine surface mean for April 2022 was 1909.9 ppb. The above image shows that, on September 4, 2022 am, the MetOp satellite recorded a mean methane concentration of 1904 ppb at 586 mb, which is close to sea level. At 293 mb, however, the MetOp satellite recorded a mean of 1977 ppb, while at 218 mb it recorded a peak of 2805 ppb. 

Such high methane levels could be caused by destabilization of methane hydrates at the seafloor of the Arctic Ocean, with large amounts of methane erupting (increasing 160 x in volume) and rising up at accelerating speed through the water column (since methane is lighter than water), concentrated in the form of plumes, which makes that less methane gets broken down in the water by microbes and in the air by hydroxyl, of which there is very little in the Arctic in the first place. Such a methane eruption entering the atmosphere in the form of a plume can be hard to detect as long as it still doesn't cover enough of the 12 km in diameter footprint to give a pixel the color associated with high methane levels. 


The above Copernicus image shows a forecast  for September 9, 2022 18 UTC, of methane at 500 hPa. 

In the video below, from this page, Guy McPherson addresses the question: Has the “Methane Bomb” Been Triggered?


Conclusion

The situation is dire and the right thing to do now is to help avoid or delay the worst from happening, through action as described in the Climate Plan


Links

• NSIDC - Frequently asked questions

• NASA Worldview

• NSIDC - sea ice concentration

• Nico Sun - CryosphereComputing

• NSIDC - sea ice extent

• More Frequent El Niño Events Predicted by 2040
Cutting-edge models predict that El Niño frequency will increase within 2 decades because of climate change, regardless of emissions mitigation efforts.

• Emergence of climate change in the tropical Pacific - by Yun Ying et al. 
https://www.nature.com/articles/s41558-022-01301-z

• Climate Reanalyzer

• Argo Float

• Monitoring of atmospheric composition using the thermal infrared IASI/MetOp sounder - by C. Clerbaux et al. 

• NOAA - MetOp satellite methane data 

• Copernicus methane forecasts

• Clouds feedback and tipping point

• NOAA - global methane

• NOAA - Sea surface temperature anomalies on the Northern Hemisphere 

• NOAA - Monthly Temperature Anomalies Versus El Niño

• NOAA - ENSO: Recent Evolution, Current Status and Predictions
https://www.cpc.ncep.noaa.gov/products/analysis_monitoring/lanina/enso_evolution-status-fcsts-web.pdf

• WMO predicts first “triple-dip” La Niña of the century