A huge temperature rise threatens to unfold, as the already dire situation threatens to turn catastrophic due to the combined impact of a number of developments and feedbacks.
The image below uses ERA5 data, with two trends added. The blue trend, based on 1940-2022 data, points at 3°C rise by 2044. The purple trend, based on 2008-2022 data, better reflects variables such as El Niño and sunspots, and shows that this could trigger a rise of as much as 3°C by 2025, as further discussed below. Note that anomalies are from 1850-1900, which isn't pre-industrial.

The upcoming El Niño
Temperatures are currently suppressed as we're in the depth of a persistent La Niña event. It is rare for a La Niña event to last as long as the current one does, as illustrated by the NASA image below and discussed in this NASA post. The blue line added in the image highlights an increase in peak ONI (strong El Niños) over the years.


Chances are that we'll move into the next El Niño in the course of 2023. Moving from the bottom of a La Niña to the peak of a strong El Niño could make a difference of more than half a degree Celsius, as illustrated by the image below.
 |
| [ image adapted from NOAA ] |
Joint impact of El Niño, sunspots and the volcano eruption near Tonga
 |
| [ click on image to enlarge ] |
The current cycle of sunspots is forecast to reach a maximum in July 2025. Recent observations are higher than expected, as illustrated by the images on the right, adapted from NOAA, confirming a study mentioned in the earlier post that warns that the peak of this cycle could rival the top few since records began, which would further increase the difference.

A 2023 study calculates that the submarine volcano eruption near Tonga in January 2022, as also discussed at facebook, will have a warming effect of 0.12 Watts/m² over the next few years.
The joint impact of a strong El Niño, high sunspots and the volcano eruption near Tonga could make a difference of more than 0.87°C. This rise could trigger further developments and feedbacks that altogether could cause a temperature rise from pre-industrial of as much as 18.44°C by 2026, as illustrated by the image at the top and as discussed below.
As illustrated by the image below, temperature anomalies on land can be very high, especially during El Niño events. In February 2016, during a strong El Niño, the land-only monthly anomaly from 1880-1920 was 2.95°C. Note that anomalies are from 1880-1920, which isn't pre-industrial.

Further developments and feedbacks
 A combination of further developments and feedbacks could cause a huge temperature rise. An example of this is the decline of the cryosphere, i.e. the global snow and ice cover.
 The currently very rapid decline in sea ice concentration around Antarctica is also illustrated by the animation of Climate Reanalyzer images on the right, showing Antarctic sea ice on November 16, November 29, December 15, 2022 and January 4, 2023.
Studies in Alaska and Greenland have found that submarine and ambient melting is substantially higher than previously thought.

As illustrated by the image on the right, adapted from NSIDC, Arctic sea ice extent was second lowest for the time of year on January 6, 2023.


The image below shows methane recorded by the N20 satellite on January 18, 2023, pm at 487.2 mb reaching a peak of 2624 ppb.


In the video below, Guy McPherson discusses our predicament.
Final conclusions and reflections
It's important to avoid using terminology that may cause confusion. The image below shows some terms that may cause confusion (left), and terms that could be considered to be used instead (right).


The situation is dire and threatens to turn catastrophic soon. The right thing to do now is to help avoid or delay the worst from happening, through action as described in the Climate Plan.
Links
• Copernicus temperature
• NOAA National Centers for Environmental Information, State of the Climate: Monthly Global Climate Report for October 2022, retrieved November 16, 2022
https://www.ncei.noaa.gov/access/monitoring/monthly-report/global/2022010/supplemental/page-4
• Tonga volcano eruption raises ‘imminent’ risk of temporary 1.5C breach https://www.carbonbrief.org/tonga-volcano-eruption-raises-imminent-risk-of-temporary-1-5c-breach
• Tonga eruption increases chance of temporary surface temperature anomaly above 1.5 °C - by Stuart Jenkins et al.
• National Institute of Polar Research, Japan
https://ads.nipr.ac.jp/vishop/#/extent
• NOAA - Climate at a Glance Global Time Series
• Critical Tipping Point Crossed In July 2019
• Another Year of Record Heat for the Oceans - by Lijing Cheng et al.
• Methane - section 16. Methane rising from Arctic Ocean seafloor

Antarctic sea ice extent is currently at a record low for the time of year (see image on the right, adapted from NSIDC).
Antarctic sea ice extent reached a record low on February 25, 2022, and Antarctic sea ice extent looks set to get even lower this year. The dangerous situation in Antarctica is discussed in more detail in a recent post.
Studies in Alaska and Greenland have found that submarine and ambient melting is substantially higher than previously thought.
Global sea ice extent is also at a record low for the time of year, as illustrated by the image below that shows that global sea ice extent was 16.67 million km² on January 5, 2023.

 |
| [ click on images to enlarge ] |
Loss of sea ice results in loss of albedo and loss of the latent heat buffer that - when present - consumes ocean heat as the sea ice melts. These combined losses could result in a large additional temperature rise, while there are further contributors to the temperature rise, such as thawing of terrestrial permafrost and associated changes such as deformation of the Jet Stream, additional ocean heat moving into the Arctic from the Atlantic Ocean and the Pacific Ocean, and methane eruptions from the seafloor of the Arctic Ocean.
A 2019 analysis concludes that the latent heat tipping point gets crossed when the sea surface temperature anomaly on the Northern Hemisphere gets higher than 1°C above 20th century's temperature and when there is little or no thick sea ice left.

The latent heat tipping point in the Arctic was crossed in 2020, while ocean heat has kept rising since, despite La Niña conditions, as illustrated by the images above and below.

Temperature anomalies were high over the Arctic Ocean in December 2022, as illustrated by the image below.

Ominously, methane levels are very high over the Arctic, as illustrated by the Copernicus image below and as discussed in section 16 of the methane page and at the Climate Alert group.

The image below shows methane recorded by the N20 satellite on January 18, 2023, pm at 487.2 mb reaching a peak of 2624 ppb.
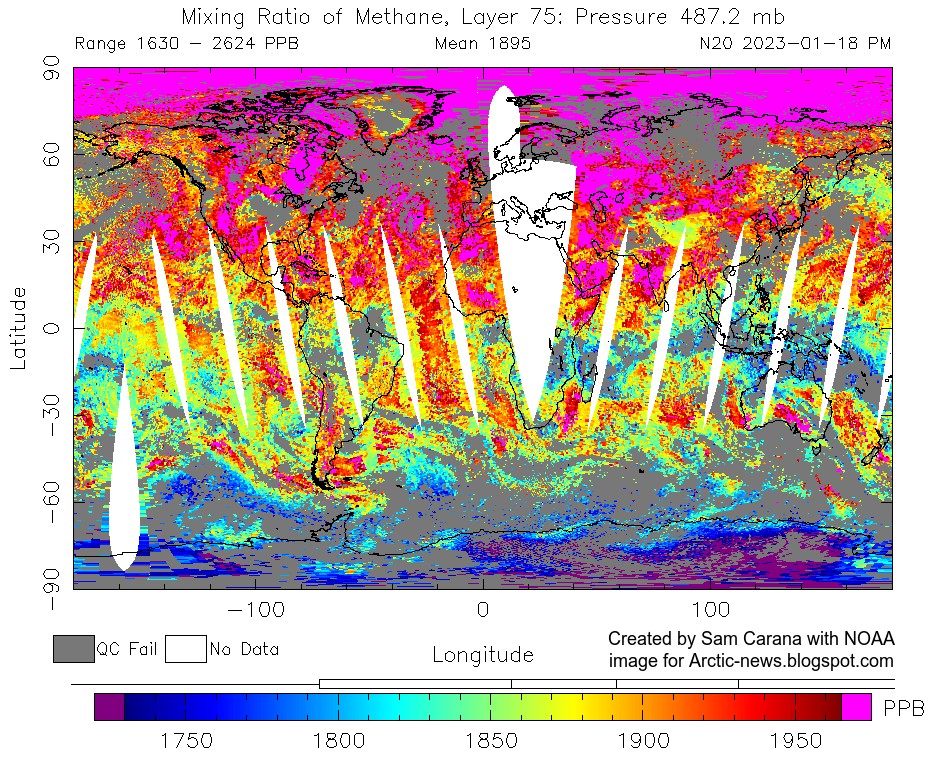
The animation below is made with images recorded by the Metop-B satellite on Jan.6, 2023 PM, showing methane at the highest end of the scale (magenta color) first (at low altitude) becoming visible predominantly over oceans and at higher latitudes North, and then gradually becoming also visible more spread out over the globe at higher altitude, while reaching its highest mean (of 1925 ppb) and peak (of 2708 ppb) at 399 mb.

This indicates that methane is rising up from the Arctic Ocean, as also discussed at the methane page and at this post at facebook.
The image below is from tropicaltidbits.com and shows a forecast for September 2023 of the 2-meter temperature anomaly in degrees Celsius and based on 1984-2009 model climatology. The anomalies are forecast to be very high for the Arctic Ocean, as well as for the Southern Ocean around Antarctica, which spells bad news for sea ice at both hemispheres.

Similarly, the image below shows a forecast for October 2023.

There are many further developments and feedbacks that could additionally speed up the temperature rise, such as rising greenhouse gases (including water vapor), falling away of the aerosol masking effect, more biomass being burned for energy and an increase in forest and waste fires, as also discussed at the Aerosols page.
As an earlier post mentions, the upcoming temperature rise on land on the Northern Hemisphere could be so high that it will cause much traffic, transport and industrial activity to grind to a halt, resulting in a reduction in aerosols that are currently masking the full wrath of global warming.
The image below shows dust as high as 9.1887 τ, i.e. light at 550 nm as a measurement of aerosol optical thickness due to dust aerosols, on January 23, 2023 01:00 UTC (at the green circle).
The image below shows dust as high as 9.1887 τ, i.e. light at 550 nm as a measurement of aerosol optical thickness due to dust aerosols, on January 23, 2023 01:00 UTC (at the green circle).

 |
| [ see the Extinction page ] |
A 2023 study concludes that the amount of atmospheric desert dust has increased globally by about 55% since the mid-1800s, resulting in a net masking effect of −0.2 ± 0.5 W m⁻² for dust aerosols alone, more than climate models previously thought.
As discussed in an earlier post, the IPCC in AR6 estimates the aerosol ERF to be −1.3 W m⁻², adding that there has been an increase in the estimated magnitude of the total aerosol ERF relative to AR5. In AR6, the IPCC estimate for liquid water path (LWP, i.e., the vertically integrated cloud water) adjustment is 0.2 W m⁻², but a recent analysis found a forcing from LWP adjustment of −0.76 W m⁻², which would mean that the IPCC estimate of −1.3 W m⁻² should be changed to -2.26 W m⁻². When using a sensitivity of 1°C per W m⁻², this translates into an impact of -2.26°C and that doesn't even include the above-mentioned extra impact of dust. Furthermore, the IPCC's total for aerosols includes a net positive impact for warming aerosols such as black carbon, so the impact of cooling aerosols alone (without warming aerosols) will be even more negative.
The image on the right, from the extinction page, includes a potential rise of 1.9°C by 2026 as the sulfate cooling effect falls away and of 0.6°C due to an increase in warming aerosols by 2026.
The image on the right, from the extinction page, includes a potential rise of 1.9°C by 2026 as the sulfate cooling effect falls away and of 0.6°C due to an increase in warming aerosols by 2026.
In the video below, Guy McPherson discusses our predicament.
Final conclusions and reflections
It's important to avoid using terminology that may cause confusion. The image below shows some terms that may cause confusion (left), and terms that could be considered to be used instead (right).

As an example, it's better to avoid terms such as 'overshoot' and target', as illustrated by the image below.

It's important to look at the bigger picture and recognize that these developments and feedbacks could jointly cause a temperature rise (from pre-industrial) of as much as 18.44°C by 2026, as discussed at the Extinction page. Also note that humans are likely to go extinct with a rise of 3°C, as illustrated by the image below, from an analysis discussed in an earlier post and underpinned by this post.

Links
• Copernicus temperature
https://climate.copernicus.eu/globe-2022
• NASA - La Niña Times Three
• NOAA Climate Prediction Center - ENSO: Recent Evolution, Current Status and Predictions
• NOAA - Monthly temperature anomalies versus El Niño
• Cataclysmic Alignment
https://arctic-news.blogspot.com/2022/06/cataclysmic-alignment.html
• NASA - La Niña Times Three
• NOAA - Monthly temperature anomalies versus El Niño
• Sunspots
https://arctic-news.blogspot.com/p/sunspots.html
• Cataclysmic Alignment
https://arctic-news.blogspot.com/2022/06/cataclysmic-alignment.html
https://www.ncei.noaa.gov/access/monitoring/monthly-report/global/2022010/supplemental/page-4
• Tonga volcano eruption raises ‘imminent’ risk of temporary 1.5C breach https://www.carbonbrief.org/tonga-volcano-eruption-raises-imminent-risk-of-temporary-1-5c-breach
• Tonga eruption increases chance of temporary surface temperature anomaly above 1.5 °C - by Stuart Jenkins et al.
https://www.nature.com/articles/s41558-022-01568-2
• NSIDC - National Snow and Ice Data Center - Charctic Interactive Sea Ice Graph
https://nsidc.org/arcticseaicenews/charctic-interactive-sea-ice-graph
• Climate Reanalyzer
• NSIDC - National Snow and Ice Data Center - Charctic Interactive Sea Ice Graph
https://nsidc.org/arcticseaicenews/charctic-interactive-sea-ice-graph
• Climate Reanalyzer
https://climatereanalyzer.org/wx/todays-weather/?var_id=seaice-snowc&ortho=7&wt=1
• Meltwater Intrusions Reveal Mechanisms for Rapid Submarine Melt at a Tidewater Glacier - by Rebecca Jackson et al. (2019)
• Meltwater Intrusions Reveal Mechanisms for Rapid Submarine Melt at a Tidewater Glacier - by Rebecca Jackson et al. (2019)
https://agupubs.onlinelibrary.wiley.com/doi/10.1029/2019GL085335
• Greenland’s Glaciers Might Be Melting 100 Times As Fast As Previously Thought (2022)
https://news.utexas.edu/2022/12/15/greenlands-glaciers-might-be-melting-100-times-as-fast-as-previously-thought
• An Improved and Observationally-Constrained Melt Rate Parameterization for Vertical Ice Fronts of Marine Terminating Glaciers - by Kirstin Schulz et al. (2022)
https://agupubs.onlinelibrary.wiley.com/doi/full/10.1029/2022GL100654
• National Institute of Polar Research, Japan
https://ads.nipr.ac.jp/vishop/#/extent
• NASA - GISS Surface Temperature Analysis (v4) - Global Maps
• Another Year of Record Heat for the Oceans - by Lijing Cheng et al.
• Copernicus - methane
• NOAA - methane MetOp-B satellite
• Methane - section 16. Methane rising from Arctic Ocean seafloor
• Tropicaltidbits.com
https://www.tropicaltidbits.com
• The upcoming El Nino and further events and developments
• Cold freshwater lid on North Atlantic
• Pre-industrial
https://arctic-news.blogspot.com/p/pre-industrial.html
• Invisible ship tracks show large cloud sensitivity to aerosol - by Peter Manhausen et al.
https://www.nature.com/articles/s41586-022-05122-0
• Methane keeps rising
https://arctic-news.blogspot.com/2022/10/methane-keeps-rising.html
• Global warming in the pipeline - by James Hansen et al.
https://export.arxiv.org/ftp/arxiv/papers/2212/2212.04474.pdf
• Latent Heat
https://arctic-news.blogspot.com/p/latent-heat.html
• Extinction
https://arctic-news.blogspot.com/p/extinction.html
• When will we die?
https://arctic-news.blogspot.com/2019/06/when-will-we-die.html
• When will humans go extinct?
https://www.tropicaltidbits.com
• Jet Stream
• Pre-industrial
https://arctic-news.blogspot.com/p/pre-industrial.html
• Invisible ship tracks show large cloud sensitivity to aerosol - by Peter Manhausen et al.
https://www.nature.com/articles/s41586-022-05122-0
• Methane keeps rising
https://arctic-news.blogspot.com/2022/10/methane-keeps-rising.html
• Global warming in the pipeline - by James Hansen et al.
https://export.arxiv.org/ftp/arxiv/papers/2212/2212.04474.pdf
• Latent Heat
https://arctic-news.blogspot.com/p/latent-heat.html
• Extinction
https://arctic-news.blogspot.com/p/extinction.html
• When will we die?
https://arctic-news.blogspot.com/2019/06/when-will-we-die.html
• When will humans go extinct?
https://arctic-news.blogspot.com/2022/02/when-will-humans-go-extinct.html
• Climate Plan
https://arctic-news.blogspot.com/p/climateplan.html
• Climate Plan
https://arctic-news.blogspot.com/p/climateplan.html


