 |
| Image added February 2014. Source: Massive Methane Concentrations over the Laptev Sea |
 |
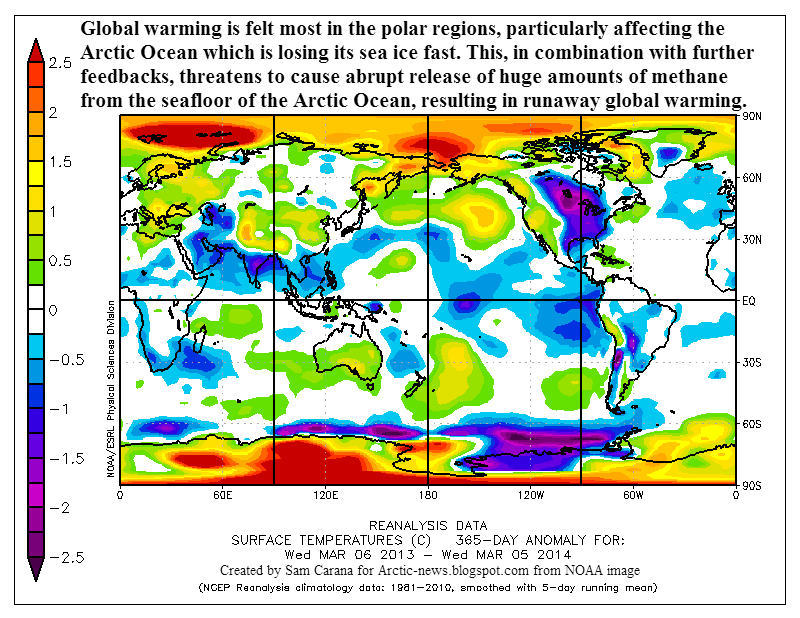
| Image added Jan. 2014. Source: Climate Reanalyzer, where daily updates are available. |
The image below shows that average world land temperature has risen approximately 1.5 degrees Celsius in the past 250 years, and about 0.9 degrees Celsius in the past 50 years.
 |
| Image added August 2012. Source: Berkely Earth, who add that the NASA GISS record had a land mask applied and the HadCRU curve is the simple land average, not the hemispheric-weighted one. |

Below is a similar graph from 1964 to 2011, this time for the higher latitudes of the northern hemisphere, and expressed as temperature anomalies from the 20th century average.

Above graph shows average annual land temperature anomalies. Since the Arctic only constitutes a relatively small part of Earth, it's easy to overlook what's happening there when looking at global averages.
Projections into the future typically use global averages in the form of relatively straight lines pointing at temperature anomalies of 2°C up to 4.5°C in the year 2100, depending on the mitigation scenario. An example of this is the IPCC image below.

In the Arctic, temperatures are rising much faster than elsewhere, and at times huge peaks can appear in some areas. Such peaks are typically masked in temperature graphs that show annual mean temperature anomalies for the entire Arctic. Averaging data annually and over a large area can mask peaks that occur locally and over short time-periods.
 |
| Image added March 2014 |
For specific months, anomalies can be very high. In November 2010, anomalies of 12.5°C were recorded at latitude 71N, longitude -79 (Baffin Island, Canada). At specific moments in time and at specific locations, anomalies can be even more striking. As an example, on January 6, 2011, temperature in Coral Harbour, located at the northwest corner of Hudson Bay in the province of Nunavut, Canada, was 30°C (54°F) above average.
Warming in the Arctic is accelerating, and this makes it hard to fit straight trend lines to such rises. Instead, exponential trends fit the data better, as shown below. The added trend line shows how temperature anomalies are projected to continue, based on historic data from 1964 to 2011.
 |
| This is a later version of the Nov 2011 image added to the poster displayed at AGU 2011 |
The image below combines these two kinds of warming, i.e. accelerated warming in the Arctic and global warming as that affects all places on Earth, including the Arctic.

The image below also has a trend line added for global warming as experienced everywhere on Earth, which shows up as a relatively straight line, much like the IPCC projections. This clearly shows how much warming in the Arctic is accelerating, something that is easily overlooked when only looking at global averages.

There is a third kind of warming to watch out for, i.e. runaway global warming. The danger of such huge temperature rises in the Arctic is that they will trigger releases of methane from hydrates and free gas in sediments under the sea. What will be the impact of abrupt release of, say, 1Gt of methane? Let's compare this with the global carbon dioxide emissions from fossil-fuel burning, cement manufacture, and gas flaring, as illustrated by the image below, based on CDIAC data 1751-2010 (incl).

Methane has an initial global warming potential (GWP) of over 100 times that of carbon dioxide. Abrupt release of 1Gt of methane would thus have an immediate additional impact equivalent to over 100Gt of carbon dioxide, as illustrated by the image below.

The IPCC gives methane a 12.4 year lifetime, with its warming impact declining over the years, in the end only persisting as carbon dioxide, as pictured below.

 |
| Image added 2013. Source: Methane hydrates |
The additional warming that this will cause in the Arctic will make the sea ice decline even more dramatically than is already the case now. The combined LWP of sea ice loss and methane is huge. This is bound to trigger further releases of methane in the Arctic, and their joint impact will accumulate, as illustrated in the image below.

The image below also includes an estimate for the current emissions from hydrates.
 |
| Image added Jan. 2014, from this source |
1. Global warming
2. Accelerated warming in the Arctic
3. Runaway global warming

Related posts
For a discussion of the many feedbacks that accelerate warming in the Arctic, also see the posts How extreme will it get? and The Biggest Story of 2013.
Notes
Editor's note 1: Above post was written early 2012 and, while it is preserved largely as it was when first added, some images have been updated over the years, as indicated in the captions. For reference, a later version of the image with trendlines for the three kinds of warming is added below, from the post Arctic Methane Impact.

Editor's note 2: In case you're looking for the post by Malcolm Light, earlier posted here under this title, the original post is still at the geo-engineering blog, but it has meanwhile been complemented by the February 2012 post Global Extinction within one Human Lifetime as a Result of a Spreading Atmospheric Arctic Methane Heat wave and Surface Firestorm.
Post by Sam Carana.
Time is of the essence to recognize the full danger of Arctic melt off and subsequent CH4 release because as recent findings on rate of Earth heat up, Arctic sea ice loss and its affect on extremes of weather indicate, what happens in Arctic affects rate of heat up of the whole Earth.
ReplyDeleteYet people fiddle and delay taking action, emergency action to address this problem in a constructive way to stop abortion of life from Earth. Mother Earth from which, and to which we owe a great gratitude to be alive today and to back a plan to stop global heat from going wild.
The wild swings of the Polar jet stream that are now happening repeatedly can be estimated in real time by looking at world map of temperature in article..
ReplyDeleteI bookmarked this and refer to it to interpret validity of comments elsewhere.
Dale,
DeleteIronically, it's the wild swings in the polar jet stream which are causing some unusually low temperatures (locally) that are convincing some people that Global Warming Claims are nothing but a hoax. Those people, of course, don't read Arctic News...
Ed
Great articles here. Its very positive that people are startng to really say it how it is. The arctic methane emergency group http://ameg.me/ are very obviously correct in pushing hard for immediate arctic temperature and icecover remediation by all the geoengineering techniques we can muster.
ReplyDeleteI've been a big fan of ocean fert for over a decade. For atmo co2 pulldown and algal biofuel. Previously i've been a bit uneasy about things like sulphate sunshields but I now think its obvious we need to deploy them immediately. I do like the TiO2 alternative AMEG suggests. We have a huge stockpile of TiO2 here in New Zealand as a by-product of ironsand steelmaking that could help with that.
Actually I think that the seriousness of the situation with regards to imminent methane releases is understated here. Particularly the effects of 1 gigaton methane release, and subsequent releases chart is illustrating 1 1Gton emission now and then 7 more sub 1 1Gton methane emissions spaced fairly regularly until everything goes off the top of the chart around 2050.
ReplyDeleteReality is that gulfstream water, and sunwarmed shallows with sst's up to 20 degC has been getting to the shallow submarine shelves of the arctic basin already, due to seaice meltback. This is melting submarine permafrost rapidly and we are almost certainly about to see at least the "40 Gton of methane available for abrupt release at any time" and then most likely most of the couple of thousand Gtons of methane stored in or under the east siberian shelf released within a decade.
Unless we can restore Sea Ice area with serious geo-engineering this year 2013.
Any chance Sam could do a chart for this page with say 40Gton release over the next 5 years and several hundred Gton over the next few decades?
- probably still an understatement with the couple thou Gton in the east siberian shelf only 25% of the arctic basin shallow water continental shelf total area, and the the high chance that the arctic submarine permafrost will all melt very rapidly releasing thousands of Gton of methane all at once.
Hi Aaron. Yes, release of 40Gt would color the image red within years. Back in 2008, Shakhova et al. considered release of up to 50 Gt of predicted amount of hydrate storage as highly possible for abrupt release at any time, so I guess we've just been lucky this hasn't happened yet. This figure looks even more threatening when adding the huge quantities of free gas that are present in sediments below the sea.
DeleteIf I have the time, I'll put this page in further context, such as done here, while using the new NASA data, as done here. Note also that the three kinds of warming described on above page are also reflected in the 3-part action plan I advocate.
Same question keeps arising making me want to respond to the theory of final increase from massive release of methane triggering subsequent release of gas inventory. The methane measured above sea ice in winter when solid and unbroken is not at record levels indicating the methane clears out vertically by rising very quickly and likely periodically swamps ozone out and introduces things (like hidden costs of food rising which affects politics to war spectrum and world stage for profit taking right now what amounts to forced blocking of what can save Earth) Enter challenge of creating active open Earth economy like Nature. 1) this can expand exponentially and give life to will to live and a zoom up productivity in the right direction; Which is in direct opposition to 2) systems decay and devolvement is so high now it is practically impossible to reverse trend now.
ReplyDelete3) creating the way or path for what should have been in place economically can at least give a new lease on life and chance for experimentation and full utilization of communications potential of internet and force of telemetry up.
Sam, Thanks for getting the map of land outlines back up on crucial current temperature map to see..
ReplyDeleteI keep getting the feeling the powers-that-be want to jerk ability to see away from the little guys alarmed
-TNX particularly that you take the time to really keep people aware of what's happening at Arctic News.
Thanks for again restoring underlying map of land outlines and key to color representation worldwide.
ReplyDeleteNow it looks like NASA data maps of Earth temp anomalies has been eliminated by powers-that-be..
This just prior of Barack giving another State of the Union speech in which he [likely pays but small mention to global warming and the danger it presents.] It is no wonder information access is under attack and net access is tampered with. The reason IPDA LIDAR satellite technology isn't flying now was to keep people in the dark and to prop up the broken system that is driving Earth to ruin. Close.
Thanks for the work you do... We need a lot more science and a lot less ideogology and satisficing behavior if survival is a possibility...
ReplyDelete440 nuclear power stations globally are bombs set to blow in flood, wind and fire.
ReplyDeleteThe West Antarctic Ice Sheet collapsed 60x in the last 2 million years, at around 14.44'C global average surface temperature, as glacial melt-water entered the super-volcanic magma chamber and caused a hydro-magmatic explosion in the Rift Abyss.
2340 years ago it blew a 200km2 hole in the ice with a global flood and 5000 years ago it collapsed the ice sheet, with a 5 metre global flood. The super-volcano is now active beneath the ice and could explode at any time. Such floods are usually accompanied by earth-quakes, volcanicity, tsunamis and 12 metre storm surges.
When we hear the roar and see the fire it may be too late. We need low interest funding for solar pv, solar hot water, electric boilers, electric cars, etc, now, 2015, to bring the global temperature down to 14.3'C directly. We cant wait til 2020.
Nuclear power stations should be FDR to burn up existing wastes and small scale thorium, encased in concrete and buried in the ground. We must decommission all existing nuclear power stations located by the sea or in earth-quake fracture zones.
We have to act now.
God Bless, God's Witness, Bride of Yehashuah.
Talk about checks and balances! :-)
ReplyDelete